InfoSight’s VMVision is agentless per-VM monitoring, providing clear visibility into latency and performance across host, network, and storage layers.
Part 1 of the Nimble Storage InfoSight Introduction covered the asset overviews and performance analysis, and the second part in the InfoSight Introduction series explored the Wellness, Dashboard, and Reports sections. Part 3 focuses on InfoSight’s VMVision feature.
InfoSight VMVision
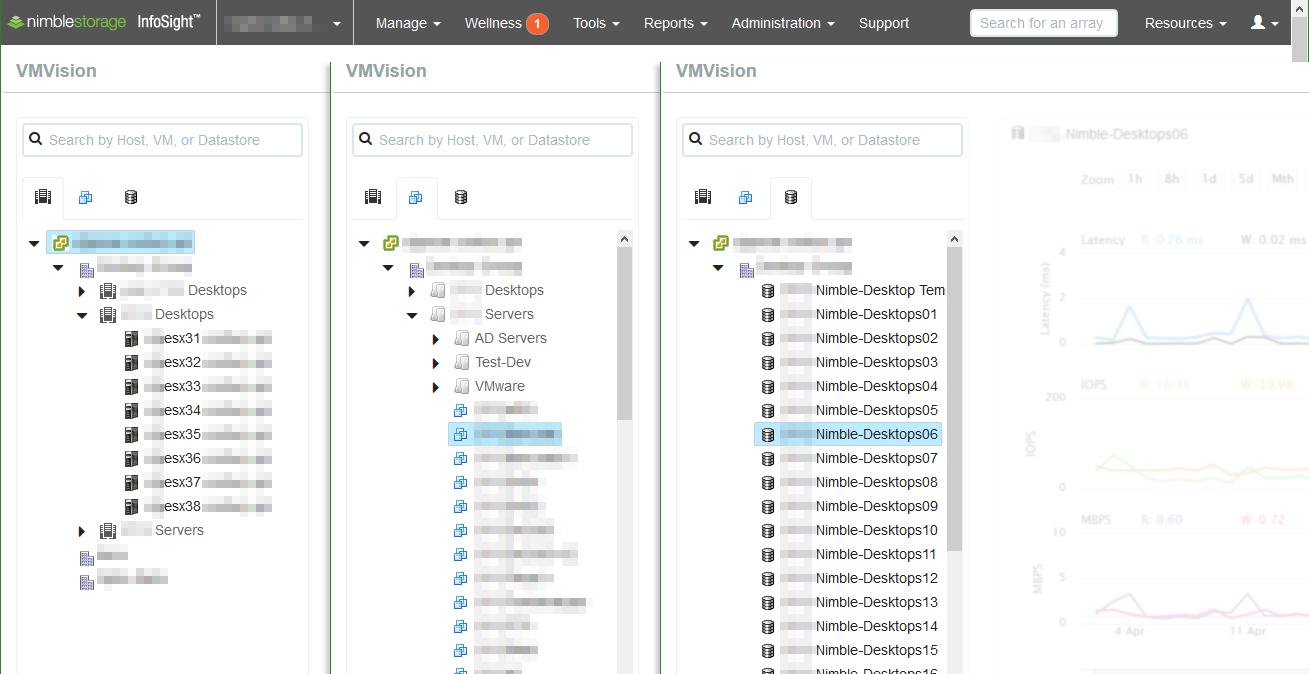
The hierarchy on the left provides a classic tree navigation similar to the vSphere Client. Starting with the Hosts and Clusters view, we see each vCenter Server and can drill down to data centers, clusters, and host servers. Next the Virtual Machines view displays virtual machine folders and individual virtual machines. Lastly, the Storage view switches the hierarchy to the datastores.
Virtual Machine Activity
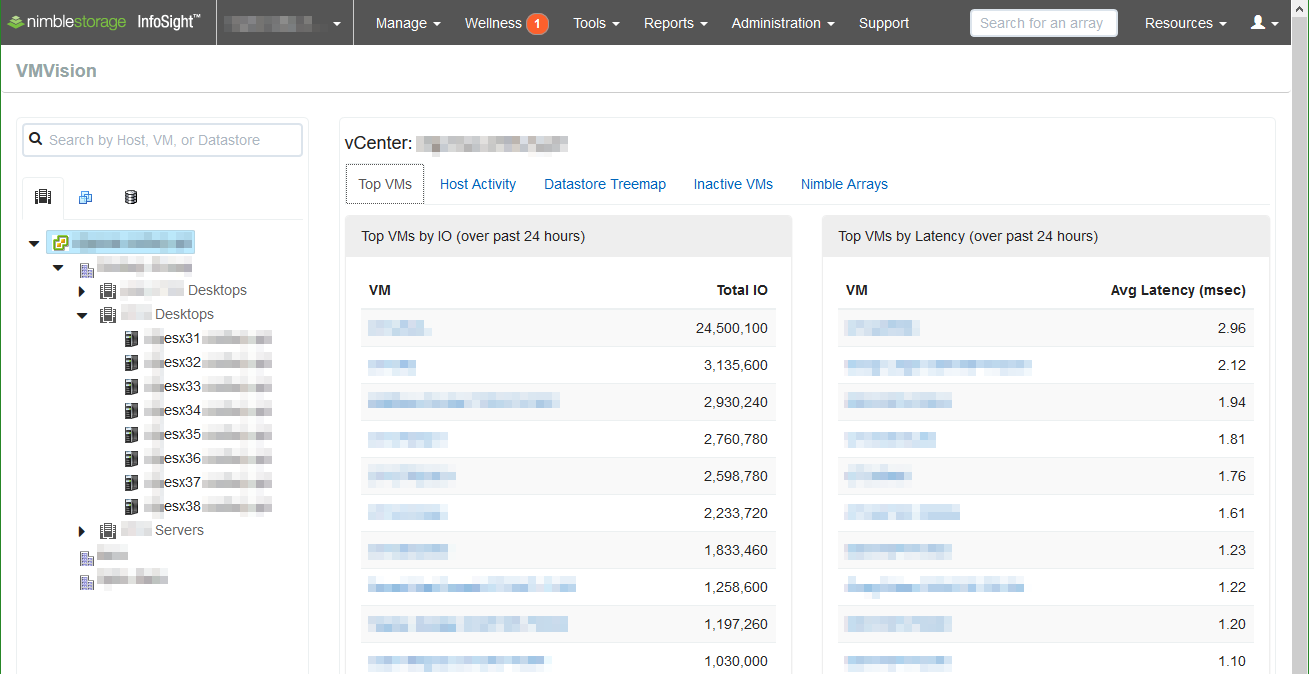
The Top VMs view delivers a list of virtual machines with highest I/O over the past 24 hours as well as a list of individual virtual machines experiencing the highest latency.
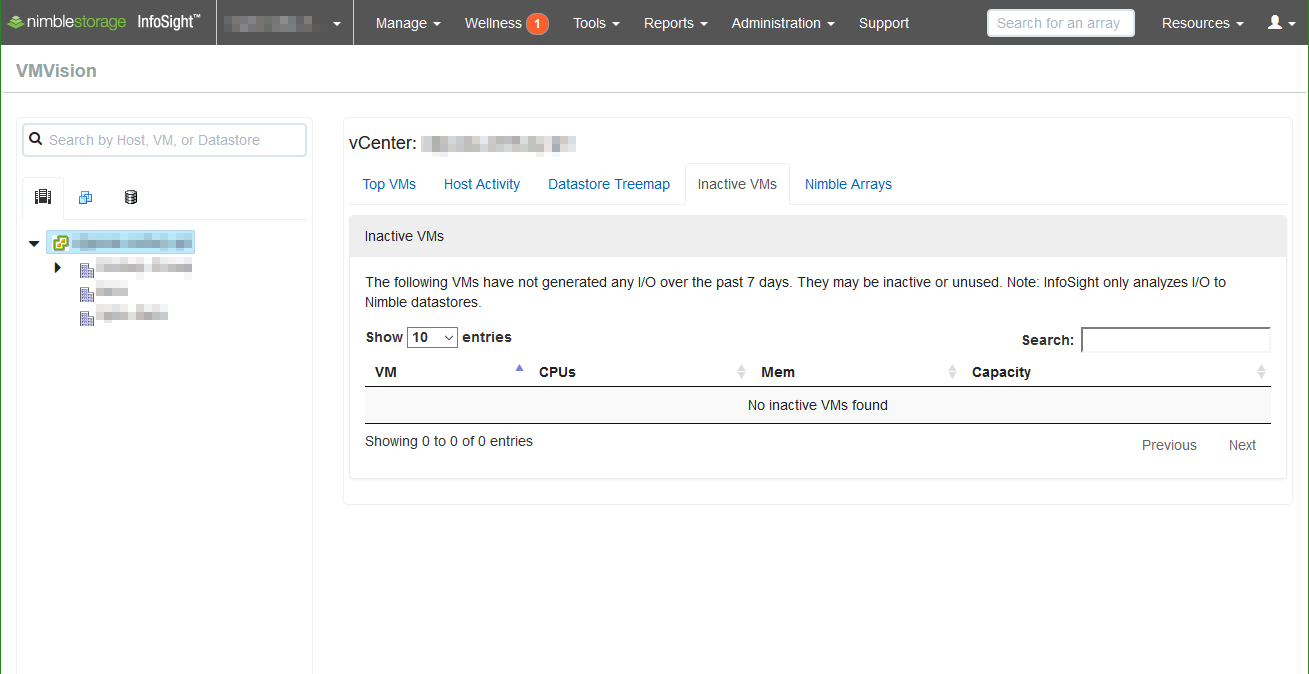
Opposite of Top VMs, Inactive VMs view is an inventory of virtual machines that have not generated any I/O over the past 7 days.
Host Activity
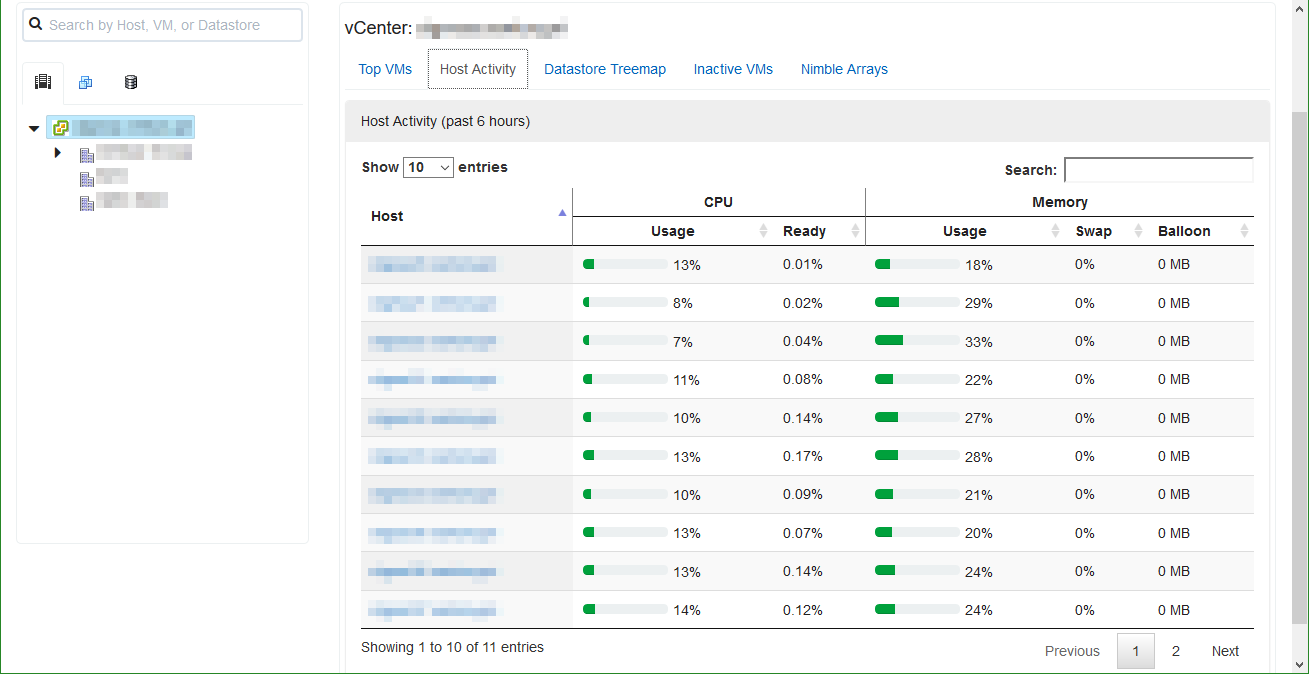
Using the tabs at the top of the window, we next select Host Activity. Host Activity provides a summary of host resource utilization over the past 6 hours.
Datastore Treemap
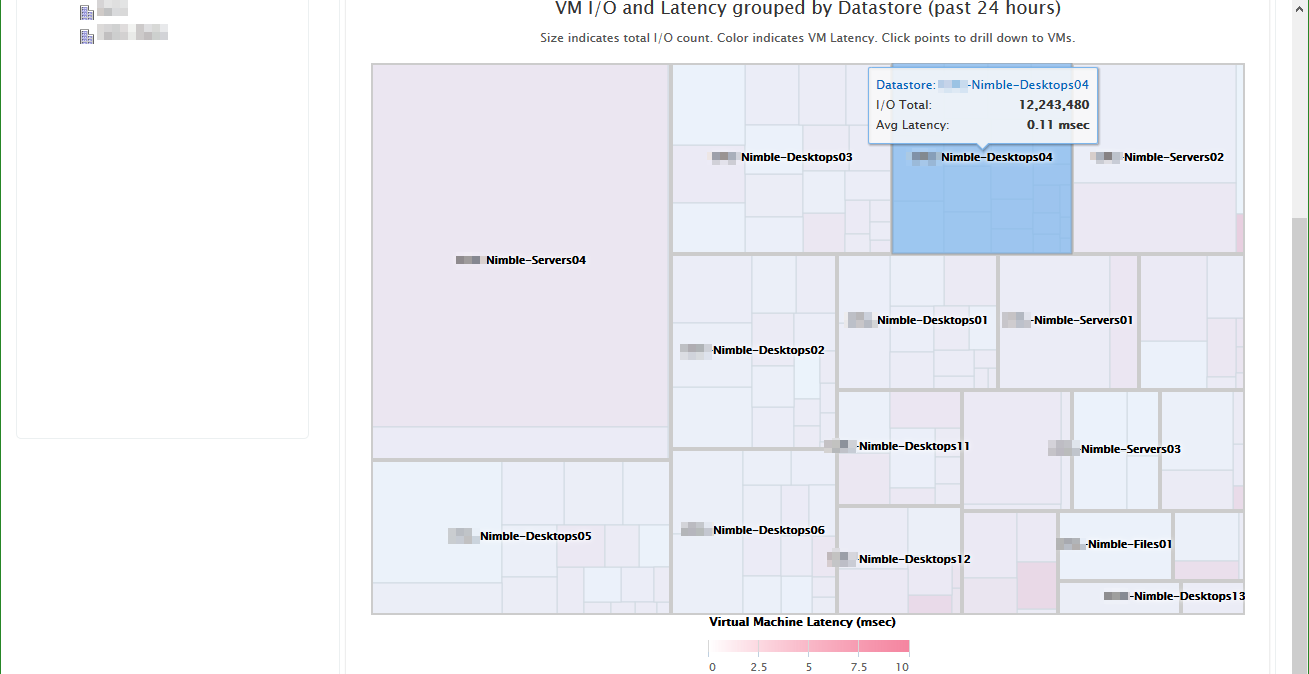
The Datastore Treemap visualizes datastore and virtual machine I/O and latency. The larger the rectangle, the more I/O performed by that object; latency is color-coded with a darker shade indicating higher latency. Move the cursor over a datastore to view total I/O and average latency of the virtual machines on a specific datastore. Clicking on the datastore focuses the view on that datastore and the associated virtual machines.
Virtual Machine Details
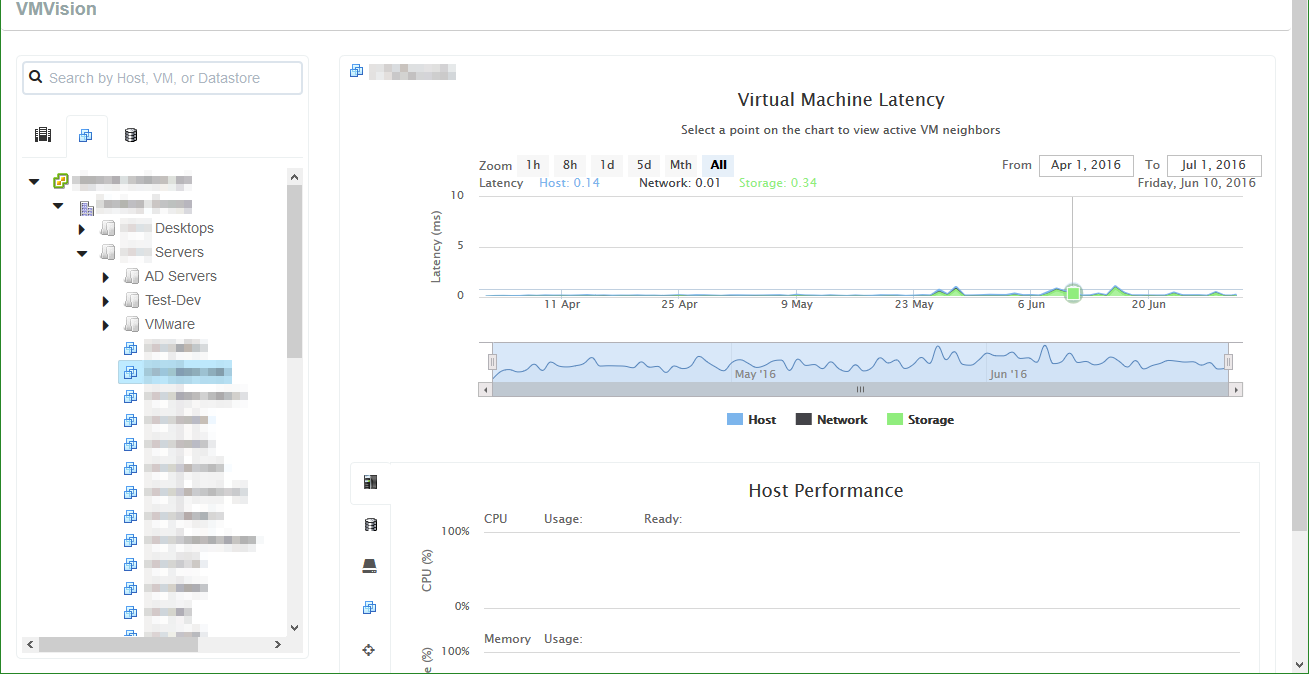
Selecting a virtual machine offers a deep dive into the historical performance of a virtual machine. The first graph is the latency of the individual VM, broken down by latency factor. The second graph provides the performance details of the associated host server, allowing us to correlate performance events between virtual machine and the host.
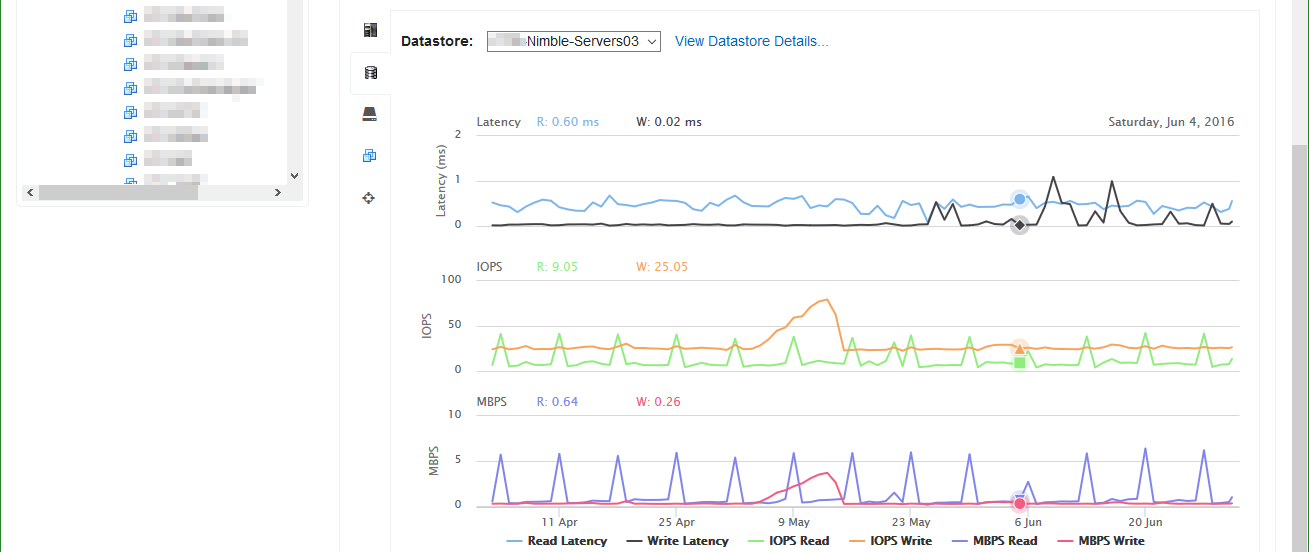
Switching the view to Datastores displays an overview of performance of the datastores associated with the virtual machine.
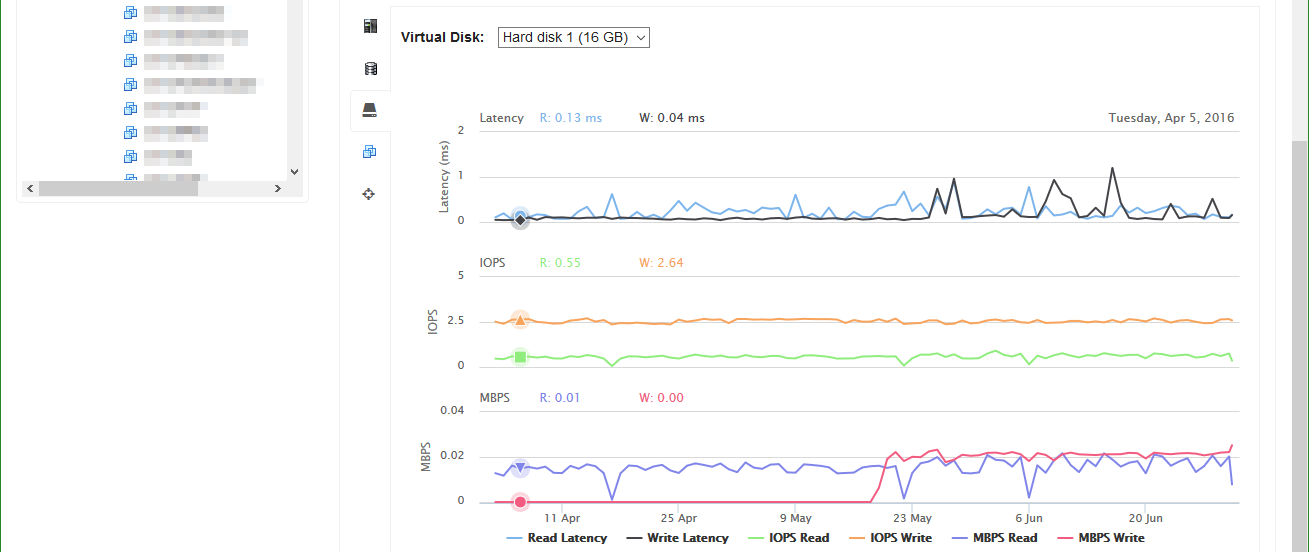
Another view specific to a virtual machine is the Virtual Machine Disks view giving latency, I/O per second, and throughput details for each virtual disk of the target virtual machine.
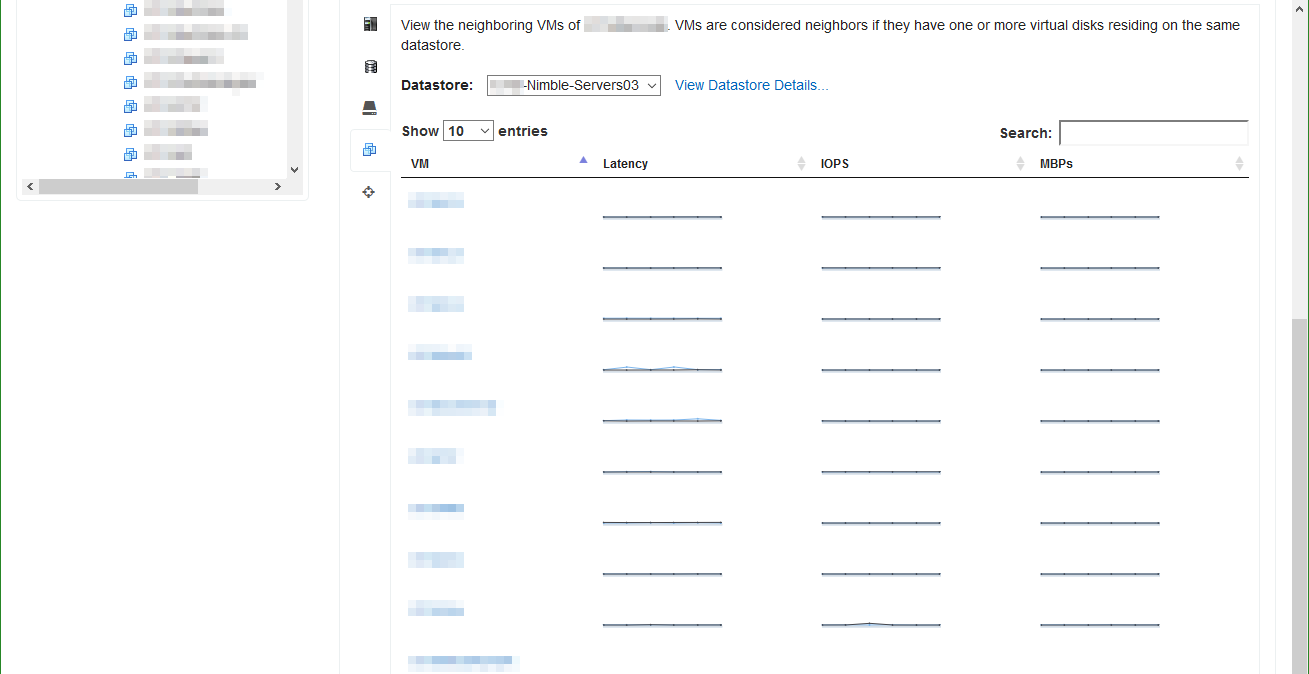
The neighboring virtual machines table catalogs virtual machines sharing the datastore with the target virtual machine, providing thumbnail graphs of latency, IOPS, and throughput metrics of each neighboring VM for comparison.
Datastores
The Datastore view displays the common latency, IOPS, and throughput charts.
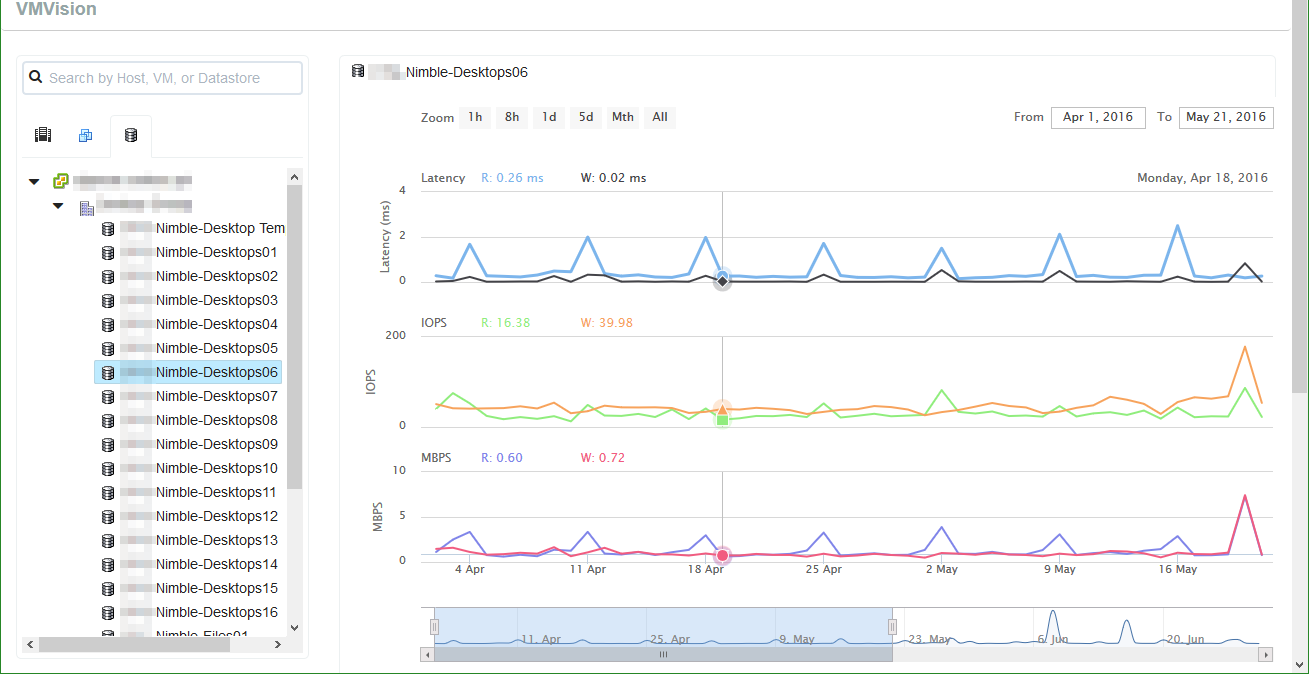
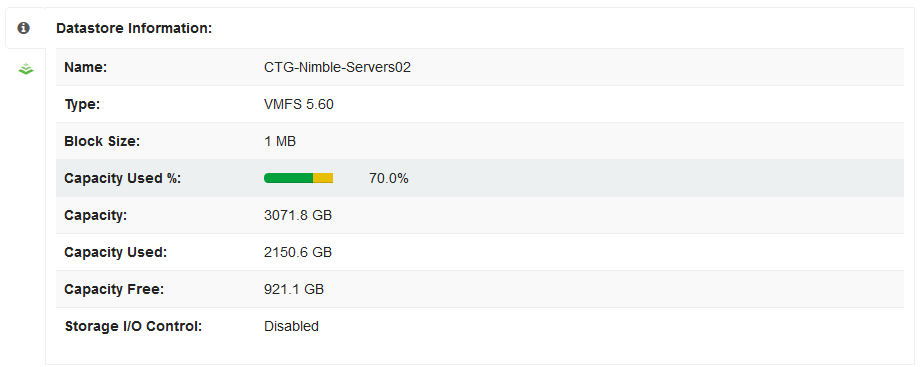
In addition to the performance statistics, the Datastore view provides further information about the datastore, and selecting the Nimble Storage icon will display the underlying array volume.
That concludes the Introduction Series on Nimble’s InfoSight. In future articles, I will focus on specific components of the InfoSight engine and exemplify situations in which we used InfoSight to diagnose and resolve faults and performance bottlenecks.
Nimble Storage InfoSight Introduction Series
- Part 1: Overviews and Performance Analysis
- Part 2: Wellness, Dashboard, and Reports
- Part 3: VMVision

Leave a Reply