In part 1 of the Nimble Storage InfoSight Introduction, we covered array overviews, historical performance monitoring, and cache utilization (churn). Part 2 will look at the Wellness, Reports, and Dashboard sections.
Wellness
The Wellness section of InfoSight displays critical, urgent, important, and for review alerts. Selecting Configure Wellness Rules presents a list of over 200 customizable rules; customization includes enabled/disabled rules, alerting enabled/disabled, automatic support case creation, and delay between new support case creation all with per array granularity.
Maintenance Windows can be scheduled in InfoSight to suppress automatic support case creation during planned maintenance.
Issues can be filtered by severity, array, and case status. Issues can also be acknowledged and cleared.
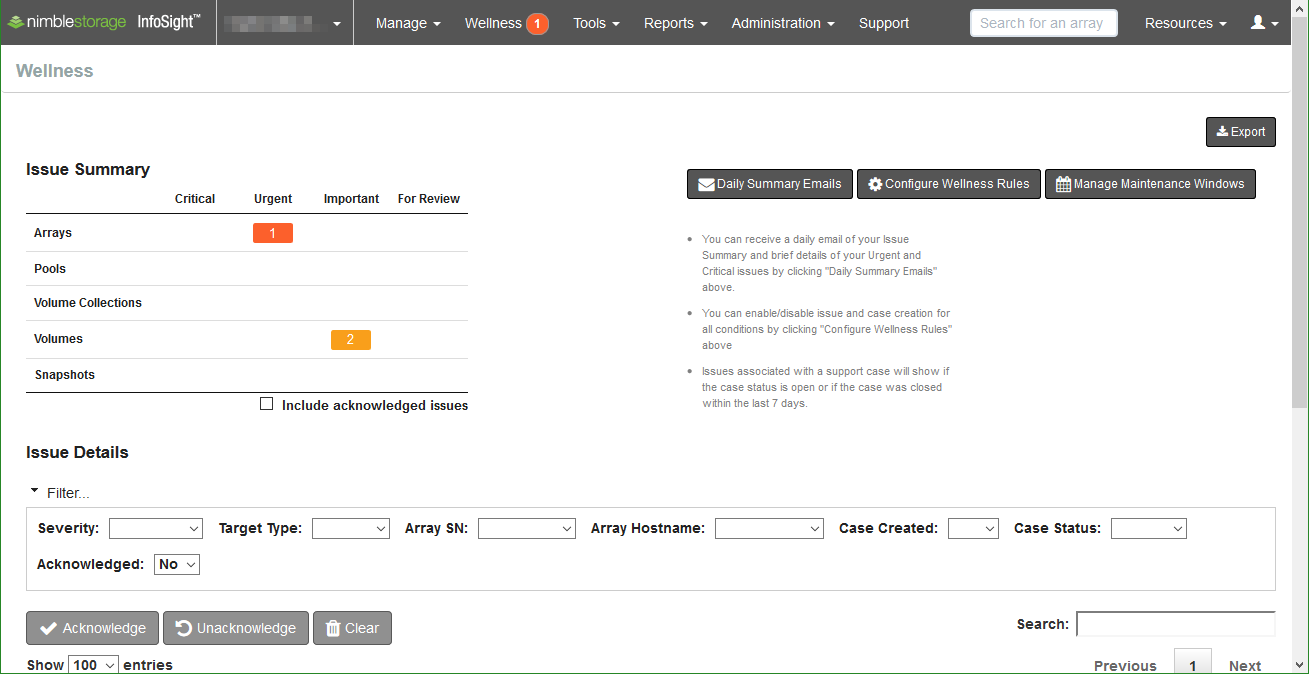
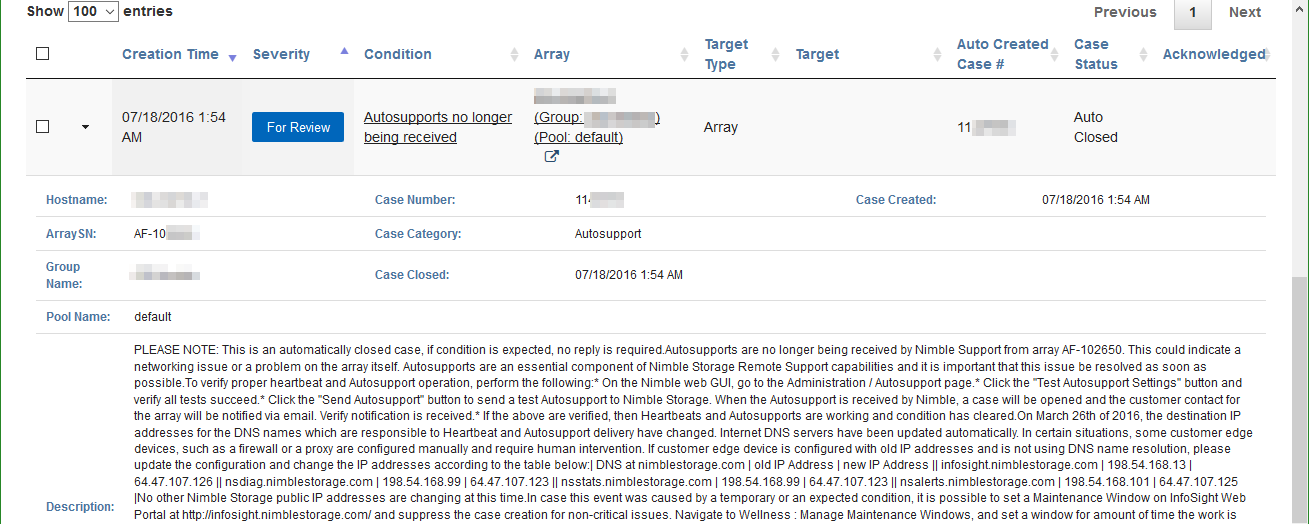
Expanding each alert provides further detail on the support case and a description towards resolution or related knowledge base articles.
Executive Dashboard
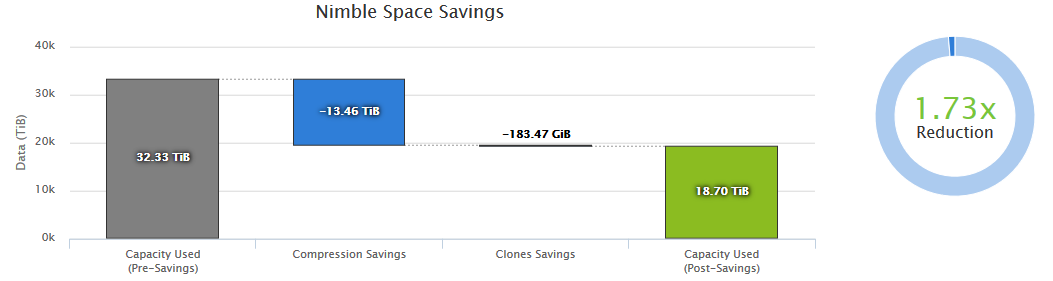
Space Savings
The Space Savings chart shows a breakdown of total capacity before data reduction, savings from compression and deduplication, savings from zero-copy clones, and the post-data reduction consumed capacity.
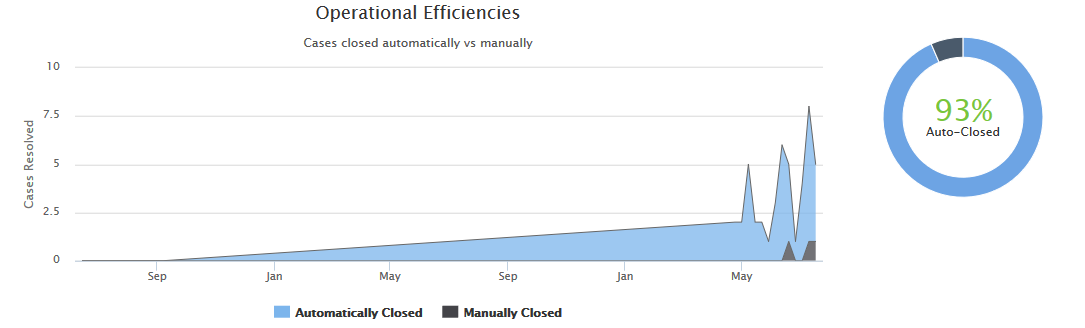
Operational Efficiencies
The Operational Efficiencies graph provides a comparison of automatically and manually closed support cases. The support cases are all of the alerts from the Wellness section discussed previously.
Data Protection
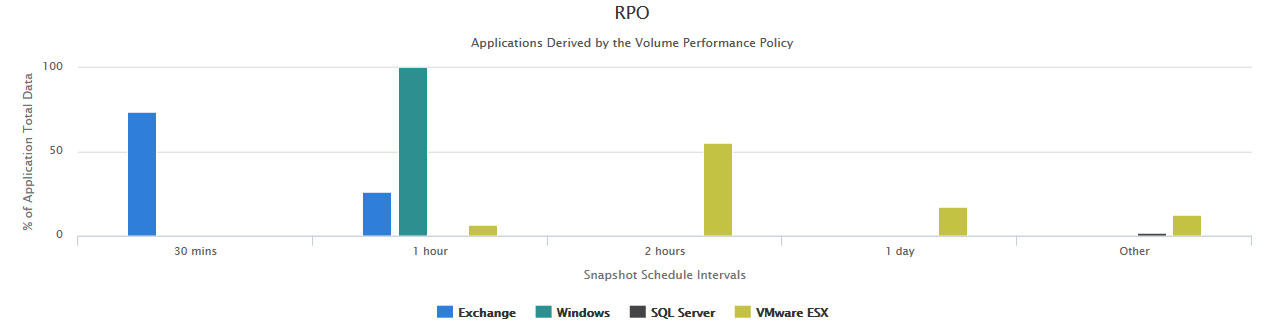
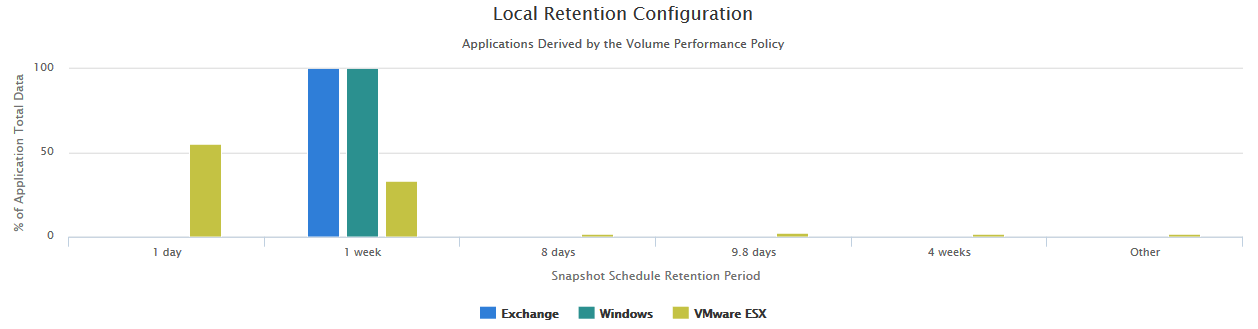
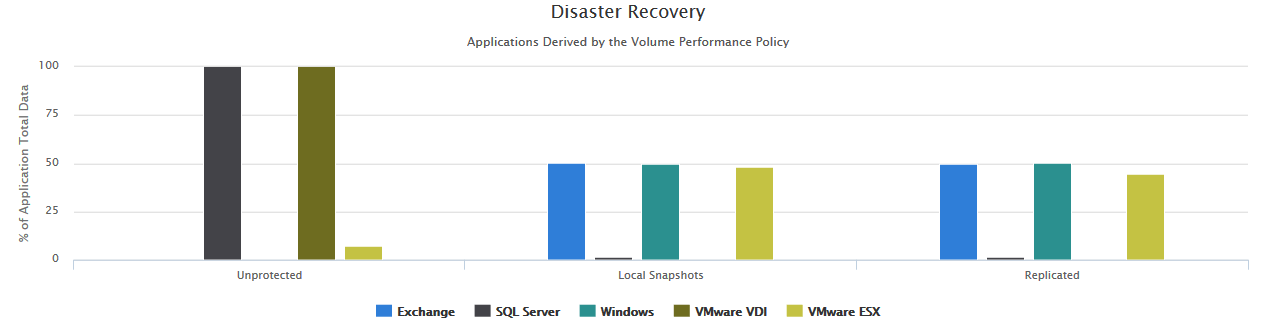
The Data Protection section of the Executive Dashboard provides an overview of Recovery Point Objectives (RPO), local data retention, and data availability for disaster recovery.
The Local Retention chart displays the amount of application data available for recovery using local snapshots.
The Disaster Recovery chart provides an overview of unprotected data, data protected by local snapshots, and amount of application data replicated to another Nimble Storage array.
Upgrade Needs
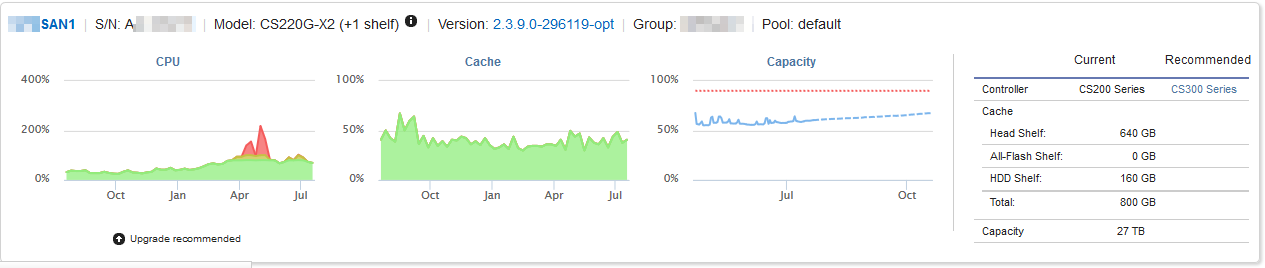
Using the last four weeks of activity, InfoSight provides recommendations on necessary upgrades (if applicable). Possible upgrade recommendations include storage controllers for the ability to process more IO per second, increased flash cache (CS series arrays only) to place more active data on flash, and capacity upgrades to increase the available usable capacity.
In this example, we observe a large spike in CPU utilization through April before “calming” down to around 80% utilization. The test performed was to monitor the impact of enabling encryption on dynamic, previous generation array.
| Nimble Storage CS300, CS500, and CS700 arrays brought a new generation of Intel processors with AES-NI (Advanced Encryption Standard – New Instructions) chipset enhancements that vastly improve the speed of encryption and decryption processes, reducing storage controller CPU utilization. |
Reports
Asset Report
The Asset Report provides the capacity and resource utilization charts and array details of each storage array. Similar to the Asset Overview page discussed in part 1, except the Asset Report includes all arrays in a single window.
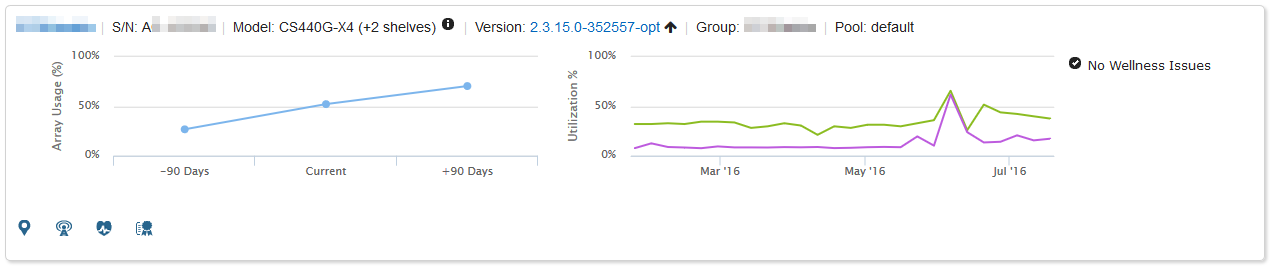
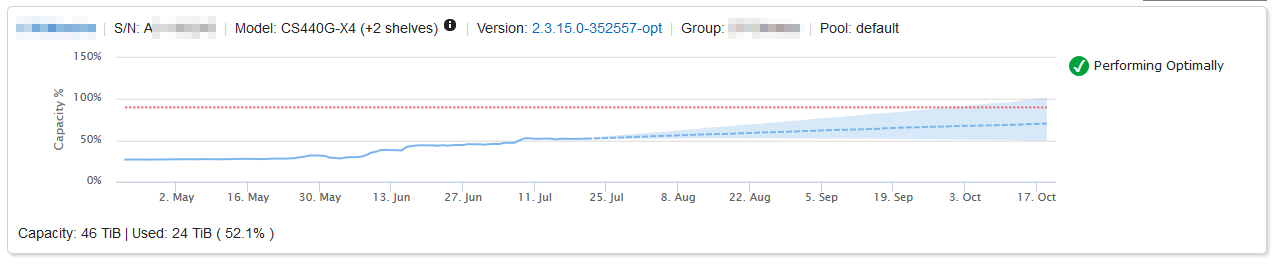
Capacity Report
Capacity Report expands on the basic Array Usage graph provided by the Asset Overview page, providing more granular detail.
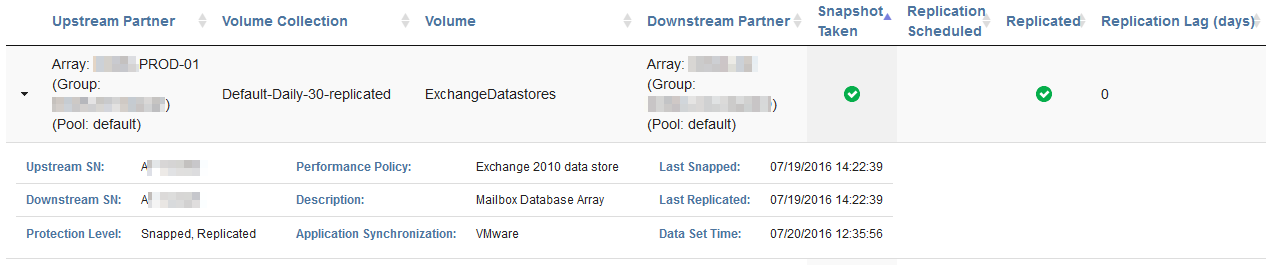
Data Protection Report
The Data Protection Report provides a table of all volumes across all assets. Dropdown menus provide filtering options, including Upstream Partner, Snapped, Replicated, Performance Policy, and Application Synchronization.
Per-volume details break down the protection level, last snapshot, last replication, and more.
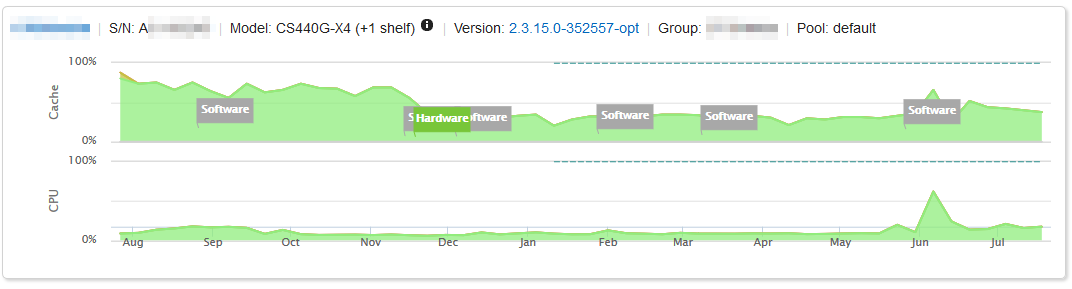
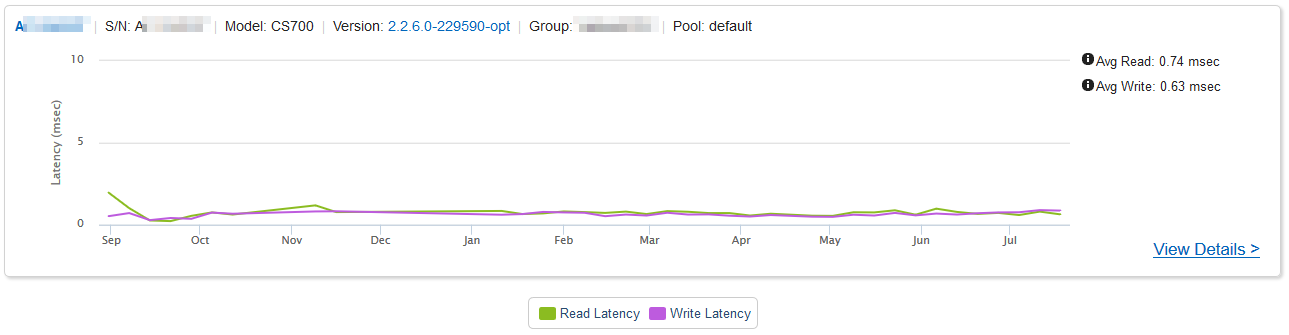
Performance Report
Performance Reports supply a historical analysis of resource utilization and latency. Software and Hardware flags present reference points to correlate infrastructure changes with alterations in resource utilization and performance.
Part 3 of the Nimble Storage InfoSight Introduction will review the agentless per-VM monitoring feature.
Nimble Storage InfoSight Introduction Series
- Part 1: Overviews and Performance Analysis
- Part 2: Wellness, Dashboard, and Reports
- Part 3: VMVision


Leave a Reply